Comparison of Spillover Densities
This page allows you to compare selected frames from the animated spillover density
You can use the dropdown menus to select key events of interest
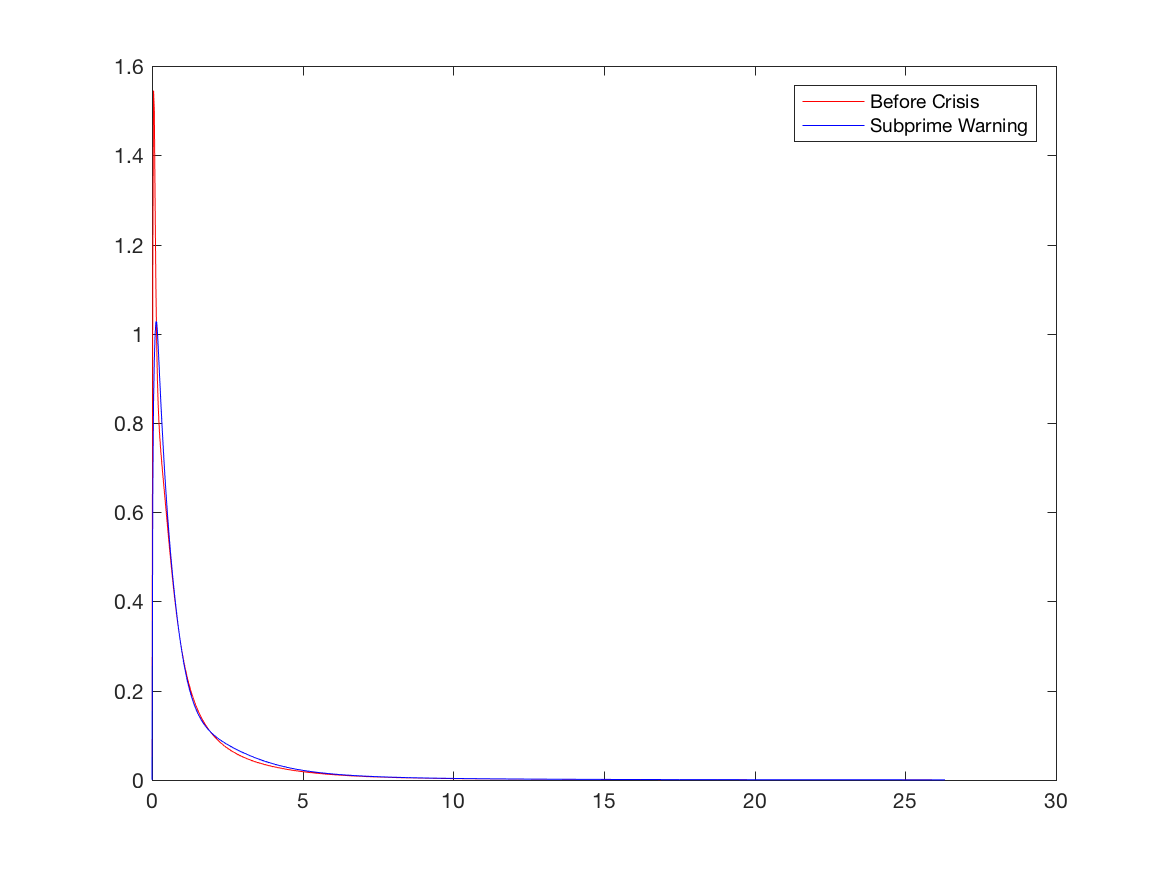
In each case, the spillover density on that day is compared to the spillover density before the financial crisis occurred
You can also choose to cumulate the spillover density if you wish
Before the financial crisis, most of the probability mass is close to zero, indicating a low probability of strong spillover effects
The spillover density moves right as the financial crisis unfolds, implying a higher probability of stronger spillover effects