Select the cases to compare below -- e.g. choose 'OLS' and '0.95' to compare the network under OLS and at the 95th conditional quantile
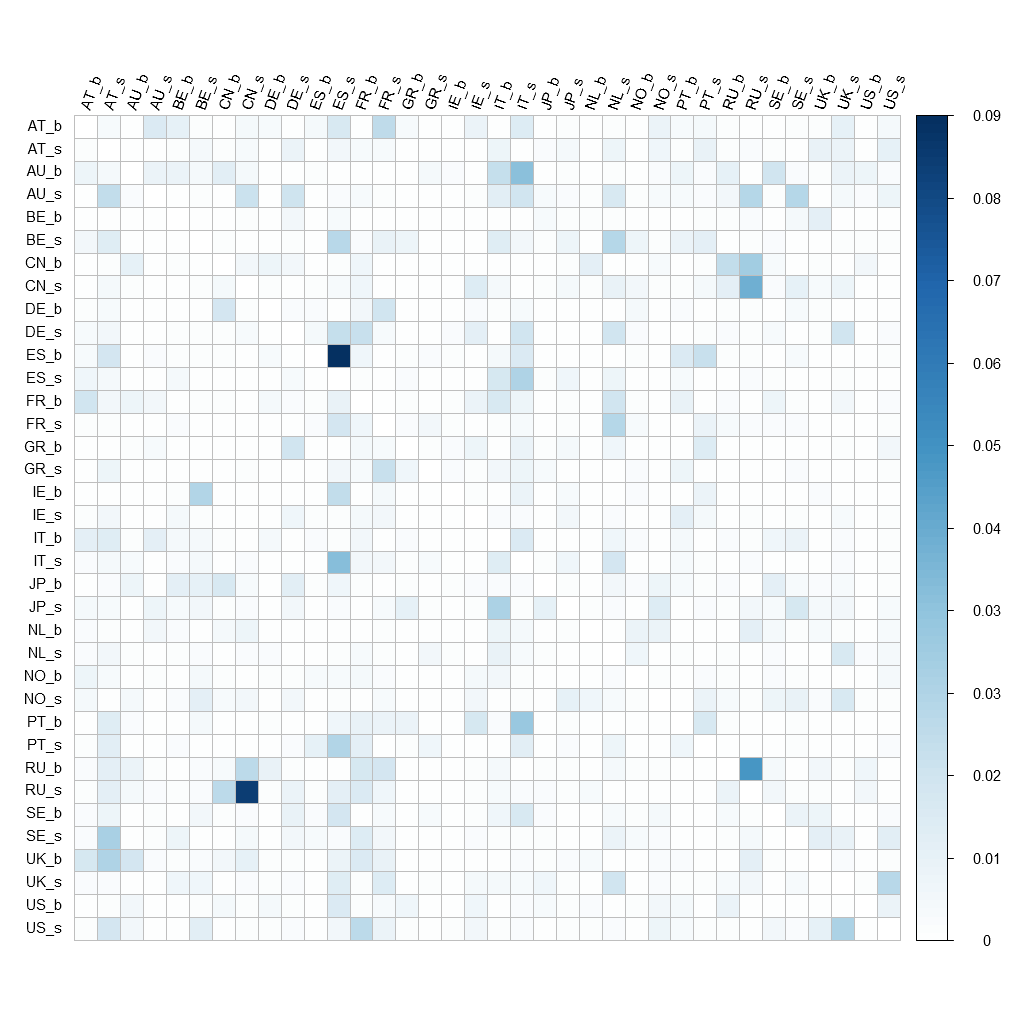
Left image:
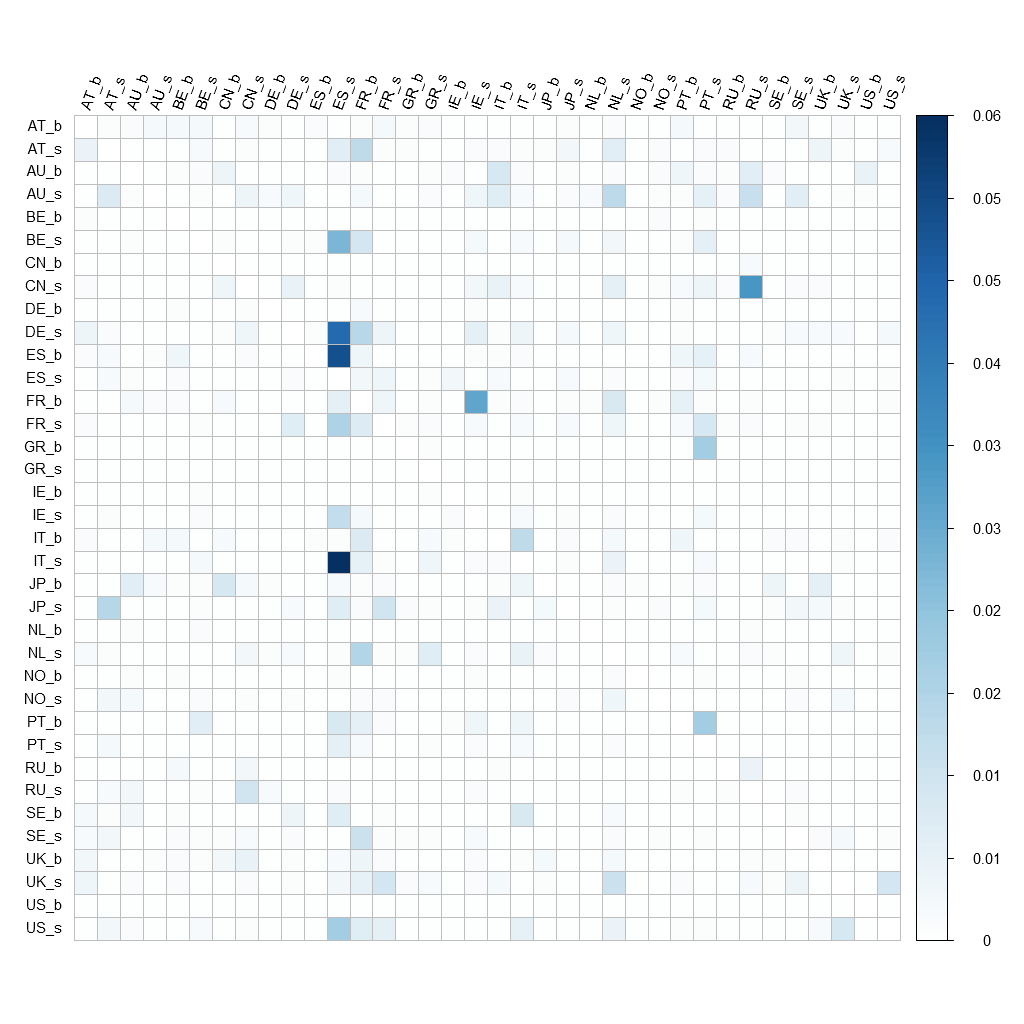
Right image:
Column headers identify the source of the spillover effect and row headers identify the target -- _s identifies a sovereign and _b a financial sector
The strength of the spillover effects is depicted by the depth of the shading -- see the vertical colourbar to the right of each figure (x100 for percent)
Spillovers intensify markely in both tails of the conditional distribution