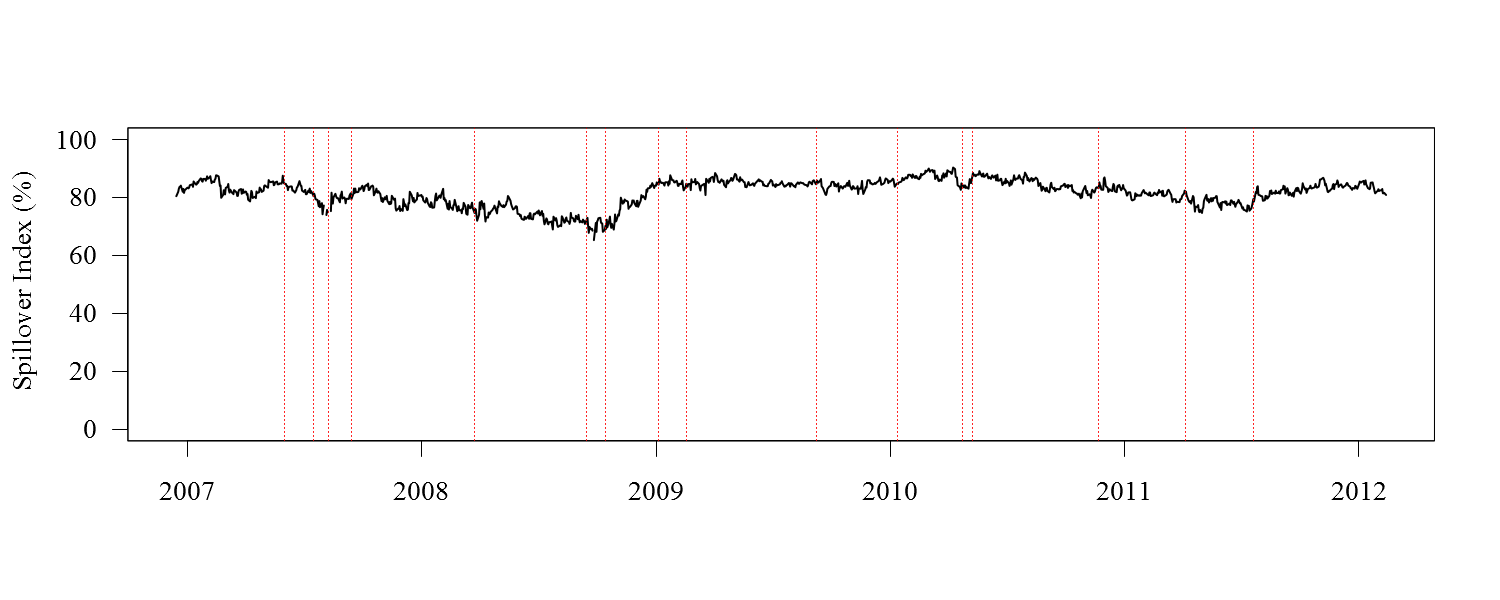
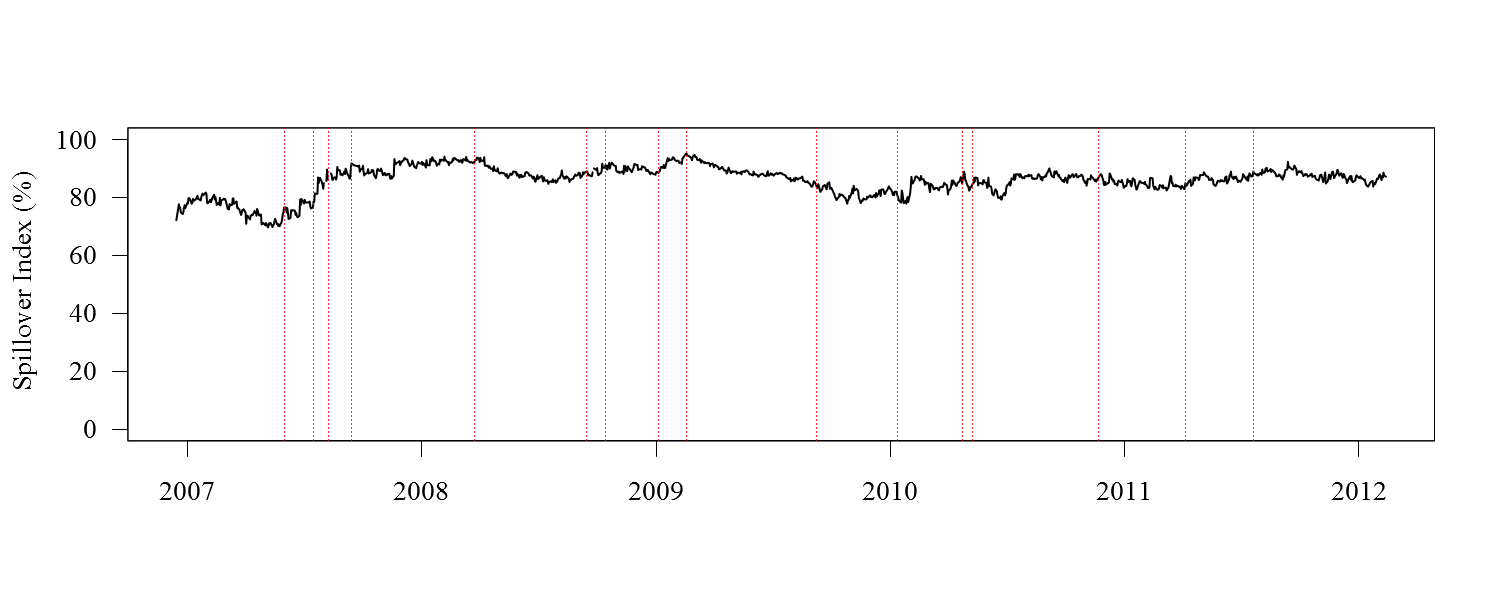
Time-Varying Spillover Index at Selected Quantiles
Upper image: Lower image:Time-varying results are obtained by estimating our model over rolling samples of 250 trading days
The horizontal date axis indicates the last day in the rolling sample
This spillover index measures the percentage of the five-days-ahead forecast error variance for the system as a whole that is explained by bilateral spillovers
Larger values indicate stronger bilateral spillovers
Vertical red lines mark key events between 2006 and 2012 -- see the paper for event details
The spillover index is much higher in both tails than in the centre of the conditional distribution