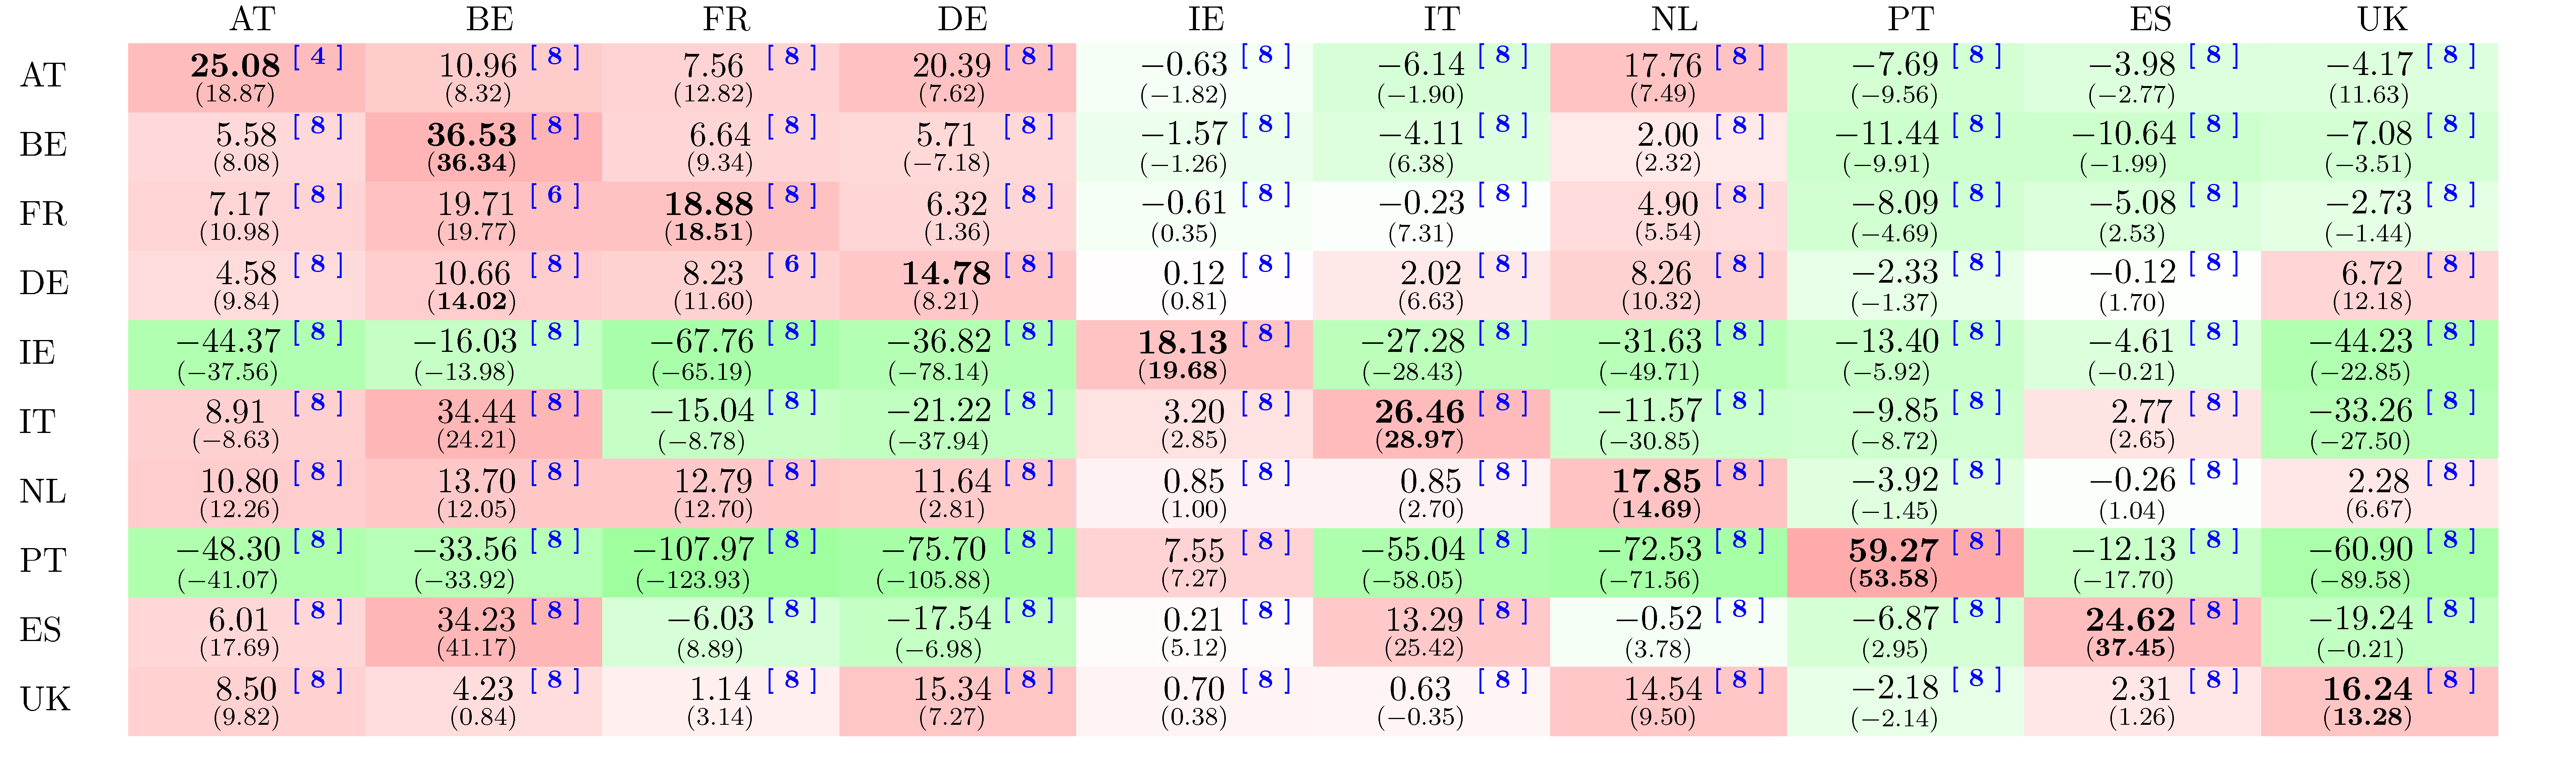
Spillover Table: Response of Sovereign Credit Risk to Domestic and Foreign Bank Bailouts
You can choose from several options below -- select results using weekly data (Wednesday value vs. Thurs-Weds average value) or monthly data (end-of-month value). Also choose either normalised or non-normalised (raw) impulse responses
The table shows the response of sovereign credit risk to structurally-identified bailout shocks -- the source of the shock is shown in the column header; the receipient in the row header
The top number in each cell shows the reponse in the period that the shock occurs (i.e. the impact response). The lower number in each cell shows the response after 4 weeks (or 2 months if you choose to view results estimated using monthly data)
Beneficial spillovers which lower credit risk on impact are shaded green; detrimental spillovers are shaded red. Values are printed in bold if there is strong evidence that the spillover effect is not zero
Each response is reported in basis points. If you select the 'normalised' view, each shock is scaled such that it reduces credit risk in the local financial sector by -50 basis points. Otherwise, the shocks are scaled to 1 standard deviation but this will differ for each country, hindering cross-country comparisons
The number shown in square brackets shows how many times the result remains unchanged through our robustness exercises -- higher is better up to a maximum value of 8